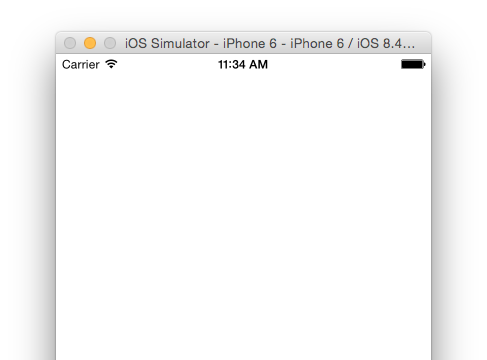
Does your AEM App get stuck at a blank screen when you run it via the Cordova CLI?
The following steps will help you get to the root of the error on both iOS and Android.
iOS
These steps assume you have a functional Cordova build toolchain (including Xcode and the iOS Simulator), and are able to run cordova platform add ios && cordova emulate ios without any CLI related errors.
Enable Develop menu in Safari
From Safari’s menu, open “Preferences…”, and navigate to the “Advanced” tab.
Make sure the checkbox labeled “Show develop menu in menu bar” is checked:

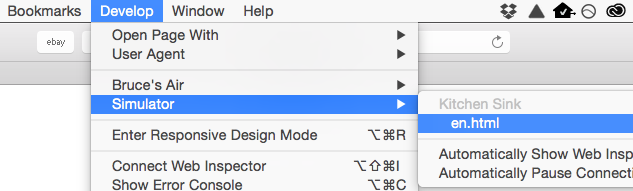
Connect the web inspector to your broken app
From the freshly enabled Develop menu, initiate a connection to your app running on the iOS Simulator (I’ll be using the kitchen-sink app for this post):
You will be greeted by a new Web Inspector Safari window that is connected to the AEM App running on your iOS Simulator.
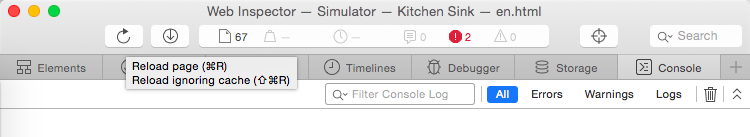
Refresh to see initialization errors
Navigate to the Console tab. You shouldn’t see any errors, aside from perhaps Safari attempting to load source maps that have not been provided. In order to see any errors which occurred during the initialization of the app, you will need to refresh the app. Locate the ‘Reload page’ button and give it a click (or: hit ⌘ + R on your keyboard):
You should now see a few lines of debug logging, along with an error!
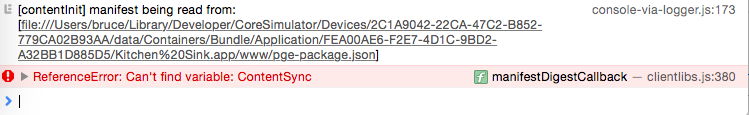
In my case it appears that the ContentSync variable is missing. This variable is exported by the PhoneGap ContentSync plugin, so I would begin my bug investigation by seeing if this plugin has been successfully installed.
If this issue is occurring on an app obtained from an open source repo, the console output is extremely valuable and should be included in your bug report.
Android
Like above, ensure that you are able to run cordova platform add android && cordova emulate android without any CLI related errors before continuing.
Connect Chrome’s web inspector to the app
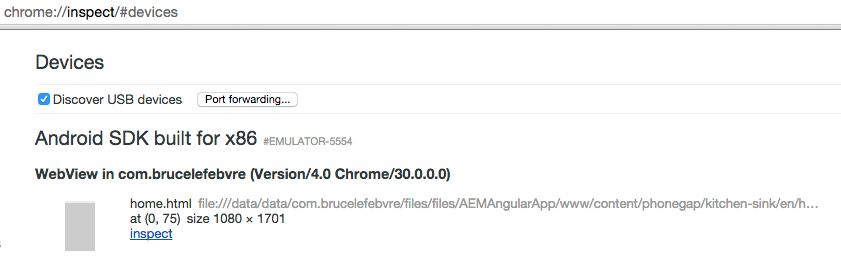
In Chrome, navigate to chrome://inspect, and locate your app’s WebView. Click the blue “inspect” link to open the remote web inspector connected to your Android emulator.
Refresh to view initialization errors
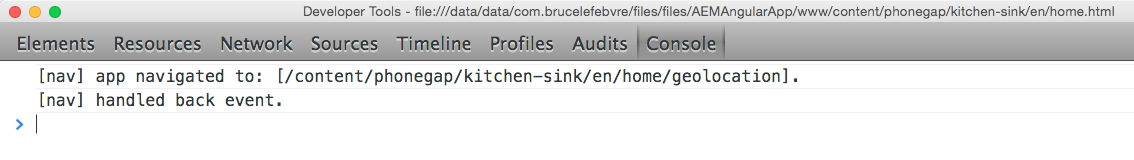
Open the console tab and hit ⌘ + R on OS X, or Ctrl + R on Windows to refresh the current page of the application. In the screenshot below, I don’t have any errors in the console but I can still view the output of console.log statements in my code, such as navigation between pages:
Happy debugging!