The open source components of Adobe Experience Manager (AEM) have excellent documentation. And yet, sometimes you may find yourself wanting to go a bit deeper. A huge benefit of using open source software is the fact that anyone can access the code to read it, review it, and (hopefully, one day) contribute back. So why not clone the source, hook up a debugger, and step through the code to see what’s really happening behind the scenes?
As a case study for this post, let’s say you’ve noticed a strange request in your production site’s logs, and want to figure out how Sling is interpreting it.
-> GET ///bin///querybuilder.json.css/style.css?path=/content/we-retail&p.limit=100&p.hits=full HTTP/1.1
For starters, I can’t recommend Reading the Docs—as a general approach applicable to most tech problems—highly enough. Sling has some great docs on its engine which can be found here: The Sling Engine. Of particular relevance to this post is the URL decomposition page which includes a table of helpful examples.
As a next step, I’d leverage AEM’s built-in tools such as the Sling Servlet Resolver page in the Web Console. The exact purpose of this page is, “to check which servlet is responsible for rendering a response”. And it is usually quite accurate. For instance, entering the request path above results in the following:
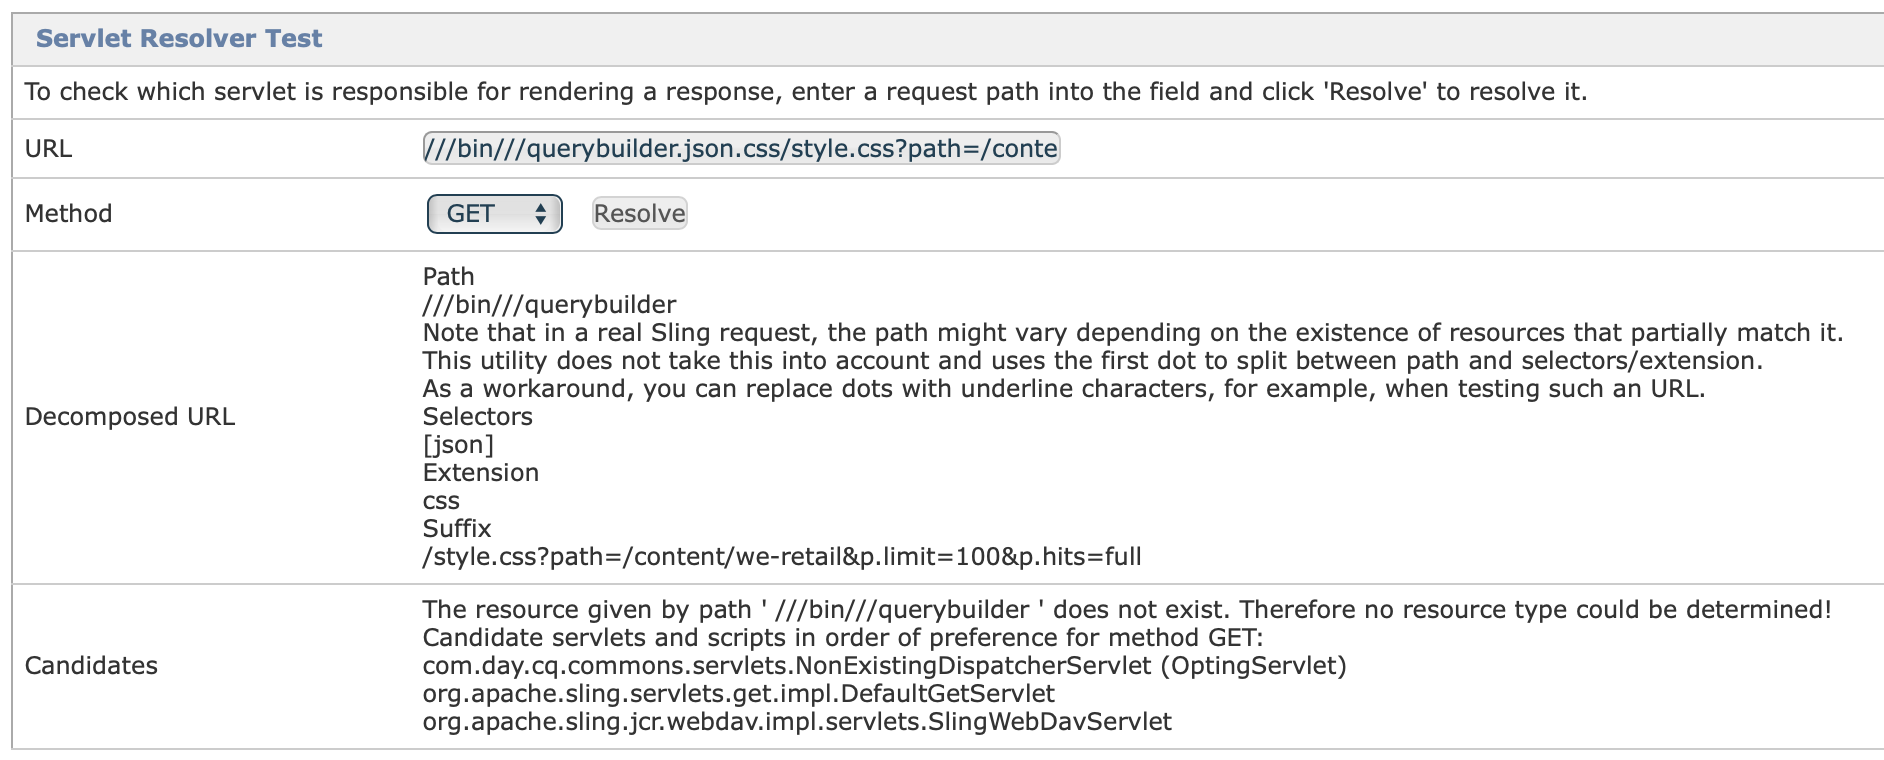
The resource given by path ‘///bin///querybuilder’ does not exist. Therefore no resource type could be determined!
It’s true that there is no resource at this path. But, this request is returning JSON data, so there must be something that is handling it.
If the docs aren’t helping and the Sling Servlet Resolver isn’t matching what you’re seeing in practice, you may need to go a bit deeper.
Get the source
To begin, clone the Sling Engine source code to your machine. It can be found here: github.com/apache/sling-org-apache-sling-engine
git clone git@github.com:apache/sling-org-apache-sling-engine.git
Check out the tag which is relevant to the version of AEM you are running. You can determine the version you need by looking in the System Console for Apache Sling Engine Implementation (org.apache.sling.engine): localhost:4503/system/console/bundles

In my case (AEM 6.5.5), Sling version 2.7.2 is being used. The names of all the tags are listed on the GitHub releases page:
git checkout org.apache.sling.engine-2.7.2
Open the source code using an IDE or code editor of your choice. You can debug Java code with a full-fledged IDE like IntelliJ or Eclipse, or opt for a lighter-weight option with the excellent Visual Studio Code editor. Just make sure you install the Language Support for Java and Debugger for Java extensions if you opt to use VS Code.
With that, you now have an exact copy of the Sling Engine source which is handling requests in your AEM instance.
Enable debug mode
In order to connect a debugger to the Java virtual machine (JVM) which is running AEM, you will need to set the agentlib:jdwp JVM arg as part of the command you use to start AEM. You can update the start script in crx-quickstart/bin/ to include this arg, or otherwise modify the command you use to run AEM:
-agentlib:jdwp=transport=dt_socket,server=y,suspend=n,address=*:40404
Note that you cannot hook up a debugger to an AEM instance which was started by double-clicking the .jar file.
Make note of the address port above: 40404. You will need this port later on when configuring your IDE.
Start AEM with this new arg in place, and you should see a log entry printed to the console indicating that it is listening:
Listening for transport dt_socket at address: 40404
Connect your IDE
This article covers the use of IntelliJ and Visual Studio Code. Other IDEs which support Java will have similar steps.
IntelliJ
Open the Sling Engine project source code with IntelliJ. On my Mac, I do so via File > Open, and then I select the folder which contains the top level pom.xml.
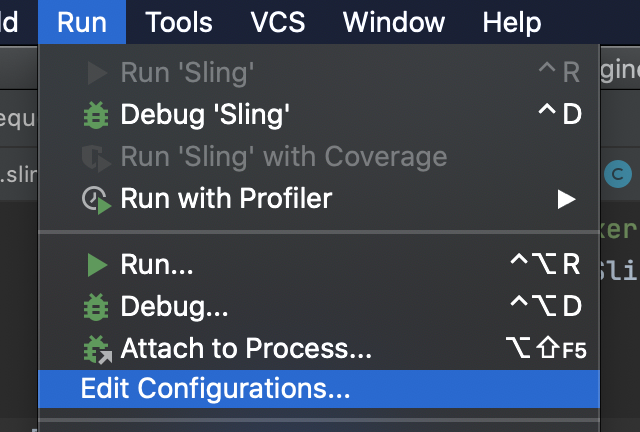
From the menu bar, select Run > Edit Configurations…:
From the left hand pane in the dialog which appears, expand Templates. Locate the Remote entry, and select it. From the top right of the dialog, click the “Create Configuration” text to create a new config from the Remote template.
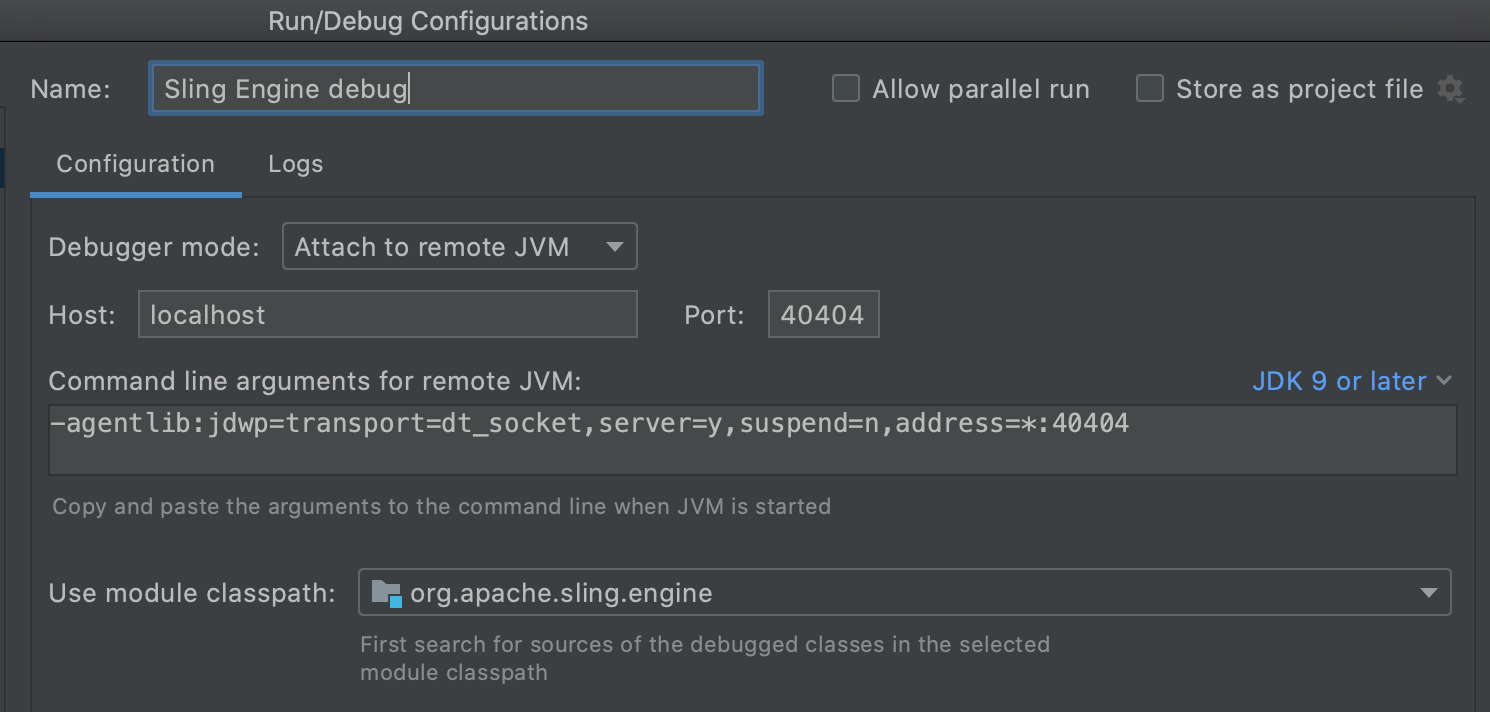
Give it a name, such as “Sling Engine debug”. Ensure Debugger Mode is set to “Attach to remote JVM”, Host is set to localhost and port is the port number you set in your JVM args above (40404 in my case):
Click “OK” to save your debug configuration.
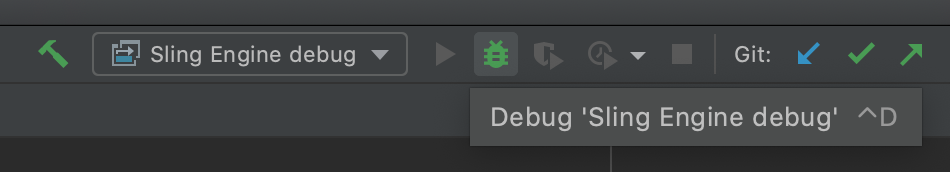
With your new configuration selected in the “Build/Run” dropdown, click the bug icon to start a debugging session.
With any luck, you should see the following message in the debugger:
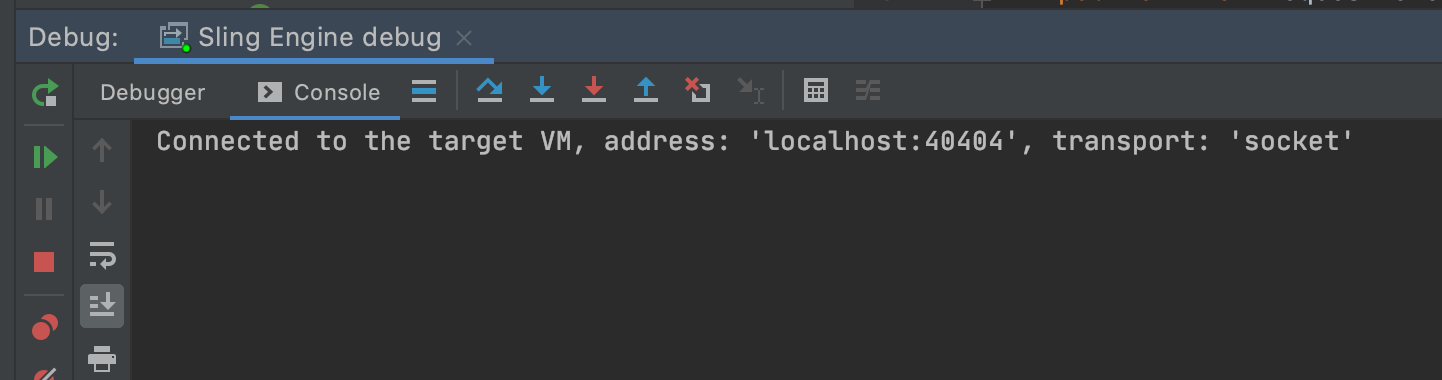
Excellent! You’re now ready to set breakpoints and step through the code. You can skip the VS Code section below.
Visual Studio Code
Ensure you have the “Language Support for Java(TM) by Red Hat” and “Debugger for Java” extensions installed.
Open the Sling Engine project source with VS Code. This can be done via the File > Open dialog, or by running code . from a terminal where the current working directory is the Sling Engine source.
Open a Java file to “activate” the extension. I picked SlingRequestProcessorImpl.java.
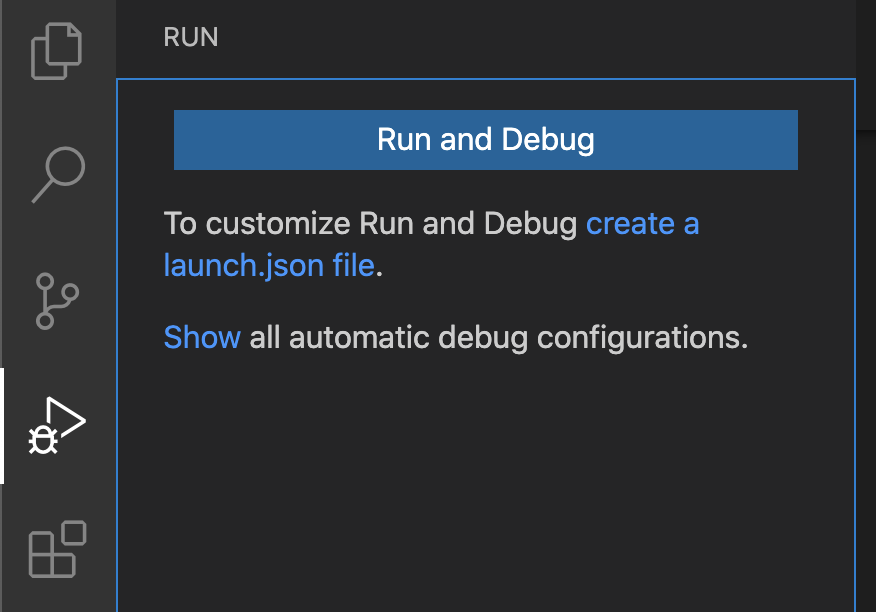
Select the Run tab, then click “create a launch.json file”.
In launch.json, change the value of request from “launch” to “attach”. Replace mainClass with hostName and port properties. As an example, refer to my configuration:
{
    "version": "0.2.0",
    "configurations": [
        {
            "type": "java",
            "name": "Debug Sling Engine",
            "request": "attach",
            "hostName": "localhost",
            "port": 40404
        }
    ]
}
Save launch.json.
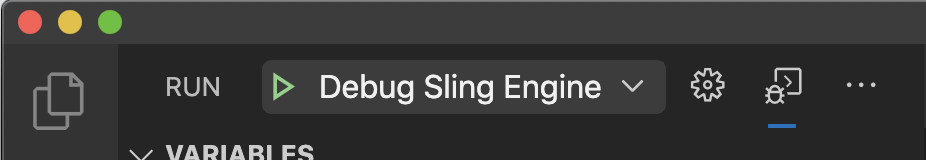
Still in the Run tab, click the Play button in the dropdown containing a list of run configs:
You may be prompted to run the Java language server in Standard mode. I said “Yes”:
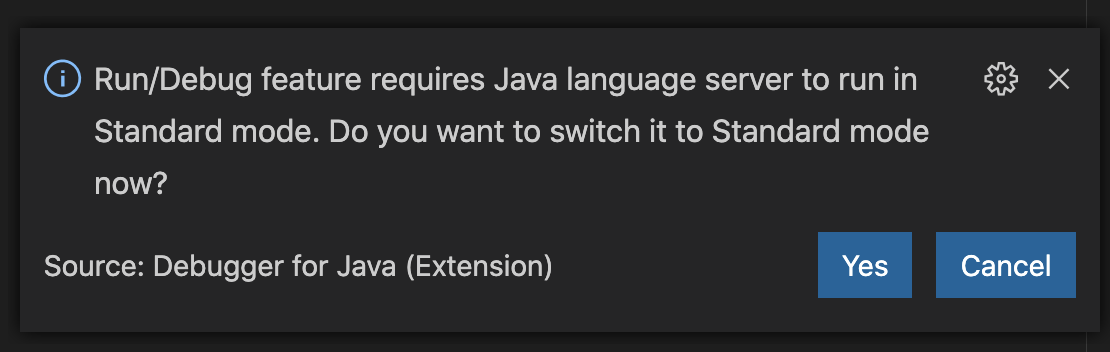
Barring any errors, you are now ready to debug!
Set a breakpoint
In your IDE/editor of choice, open SlingRequestProcessorImpl.java (any Java file works, but this one is a good place to start). In the file margin next to the line number, click to set a breakpoint on that line.
Not sure where to start? Try setting a breakpoint on line 143, just after the calls to requestData.initResource(..) and requestData.initServlet(..).
Make a request to the AEM instance that you have your debug session connected to. Since I have connected to my publish instance, the following cURL command will do:
curl http://localhost:4503/content/we-retail/us/en.html
The response should not return right away. Instead, it should hang while your editor/IDE gives you a chance to inspect the state of the code at which you set the breakpoint. In IntelliJ, you should see a screen similar to this:
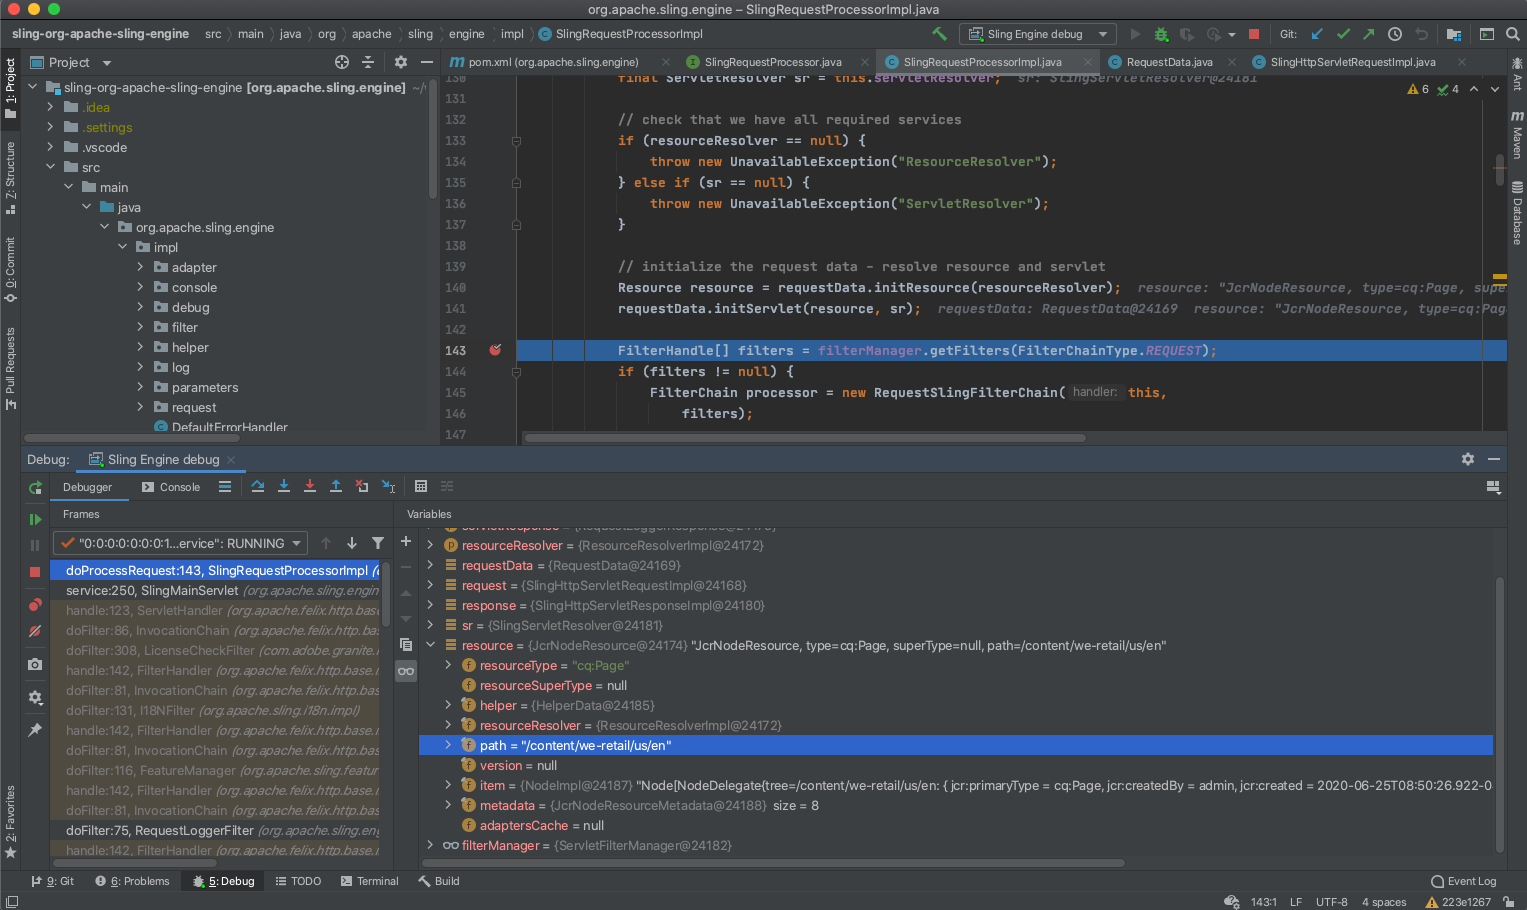
Using VS Code:
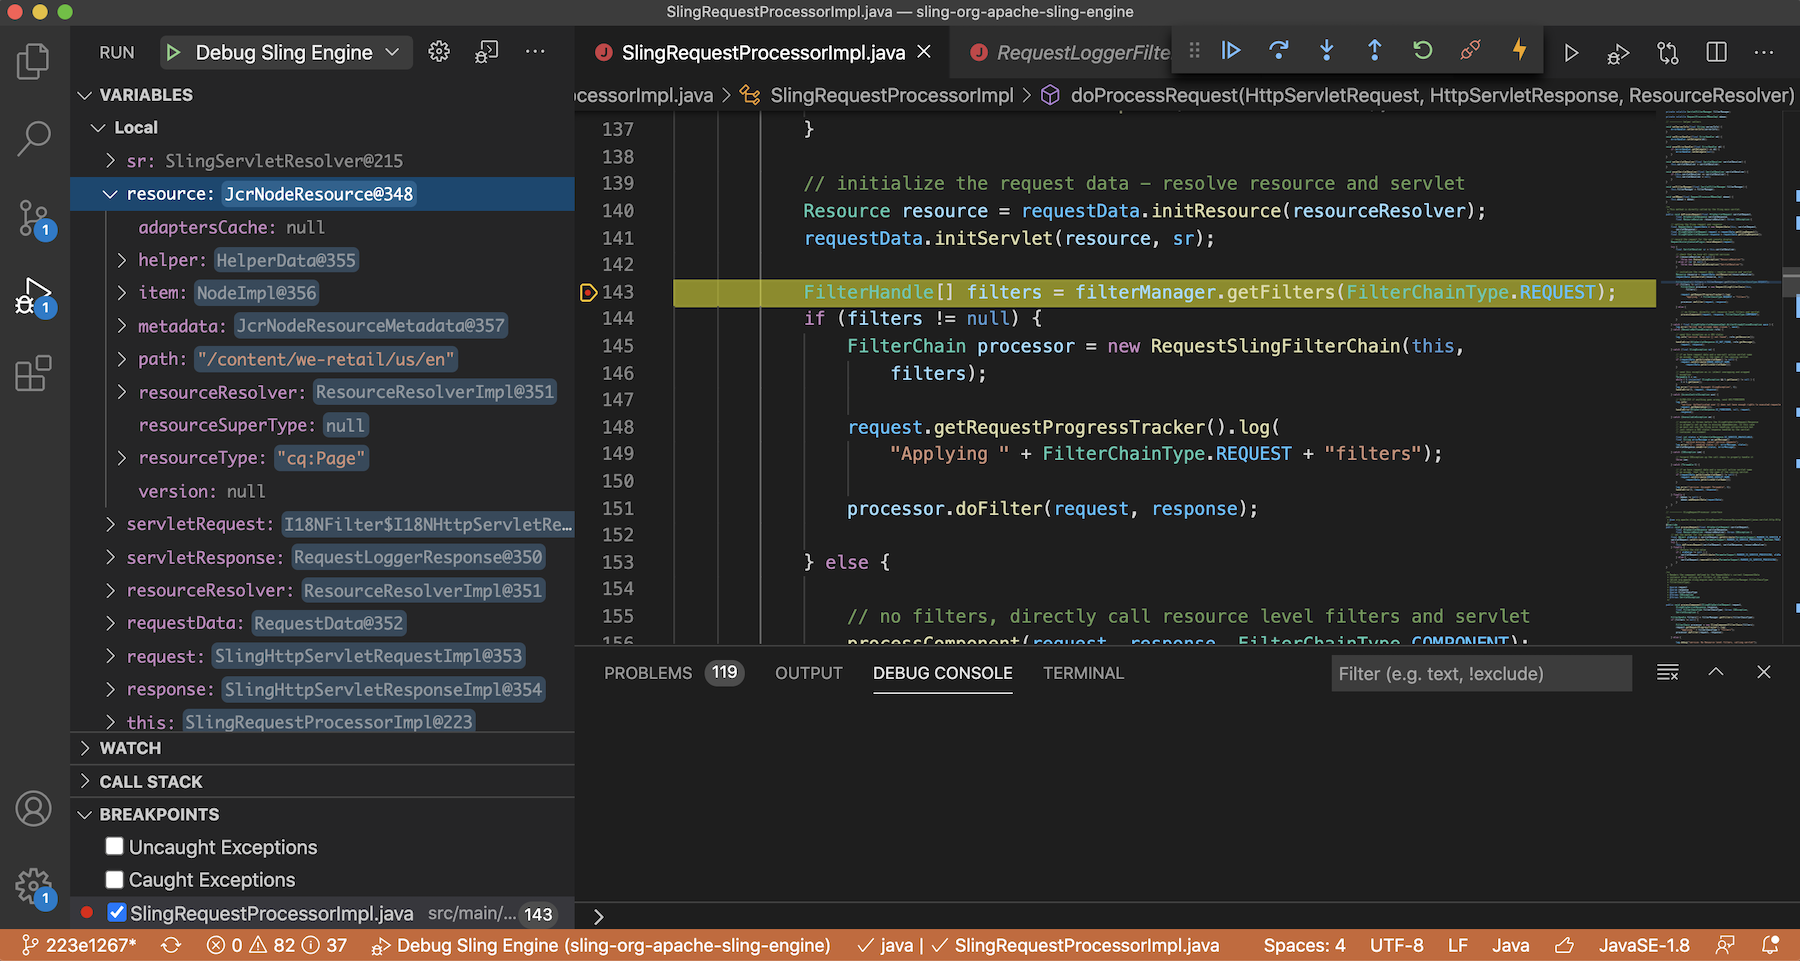
This post won’t attempt to describe everything you can do with a debugger connected (there’s a lot!), but for staters I would recommend checking out the Variables pane. For example, try expanding resource to see it’s fields including path and resourceType. By inspecting these fields you can see exactly how Sling has interpreted the current request.
URL decomposition of a tricky request
With our debugger environment configured and a breakpoint set, try issuing a request modeled after the “strange request” from the beginning of this post to see how it’s interpreted:
curl http://localhost:4503///bin///querybuilder.json.css/style.css?path=/content/we-retail&p.limit=100&p.hits=full
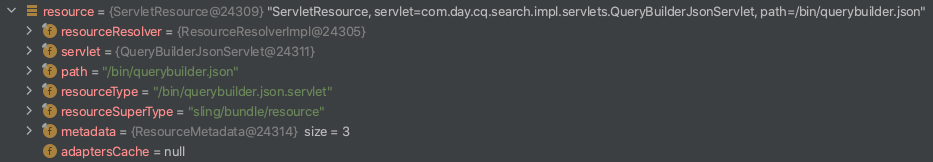
While the ///bin///querybuilder.json.css part of the request looks invalid, it is indeed being interpreted as a request to the QueryBuilderJsonServlet, which explains the response we’re seeing!
Want to go deeper? Dig into requestData.currentContentData to see how the URL has been broken down into it’s components, or step through requestData.initResource(..) and requestData.initServlet(..) to see how the URL is decomposed and the resource or servlet is determined.
Try other requests to compare, such as one to a path which does not exist:
curl http://localhost:4503/no/resource/here.html
Summary
This post has shown how you can set up your own local Sling debug environment without ever actually compiling the source or decompiling a bundle. I hope this helps build your understanding of the Sling Engine, and comes in handy when analyzing the URL decomposition and interpretation of complex requests.